Powerful web maps that bring your vision to life, share your stories, and serve as tools for understanding and using insights in ways you never imagined.
Mapping the Past
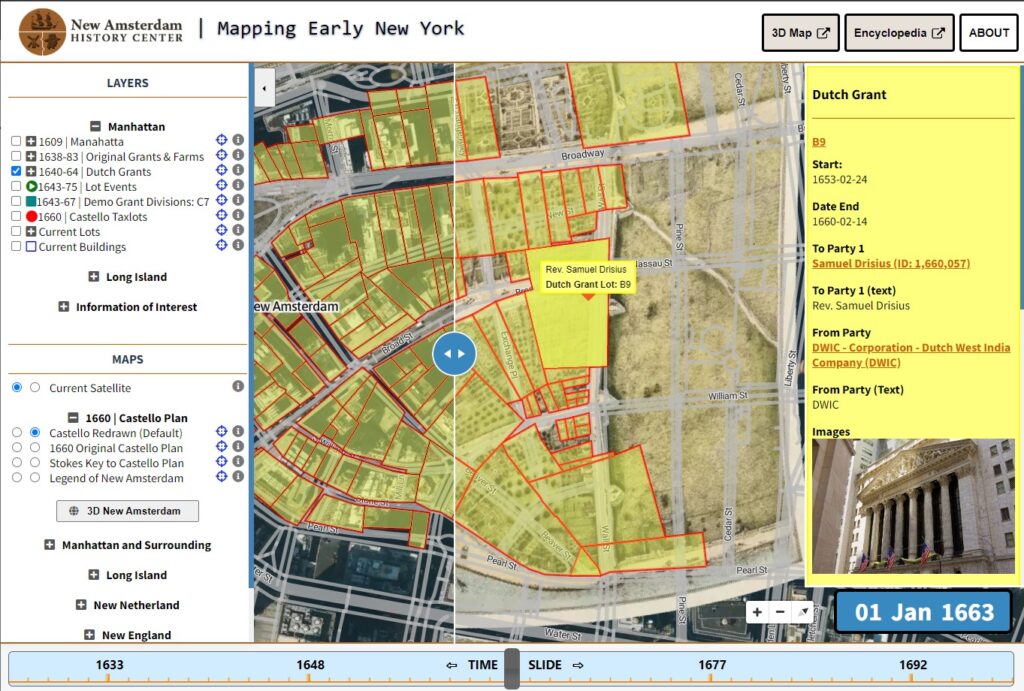
> Mapping Early New York
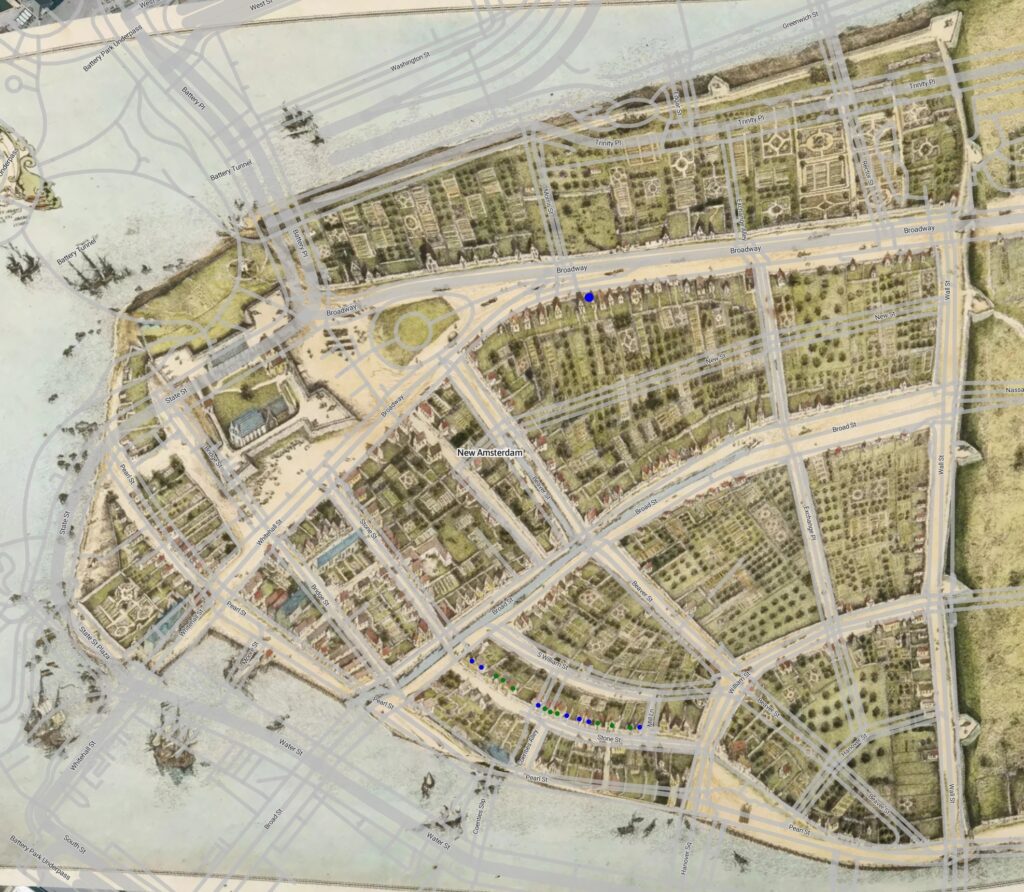
This is our most developed web map, showing the creativity and depth we are capable of, and with the use of the advanced web map application we’ve created.
It is an ongoing project under the New Amsterdam History Center to map New York during the Dutch Period in the 1600s.
Use the vertical swipe in the middle, explore the layers on the left, time slider on the bottom, and interact with features, connected to our large encyclopedia.
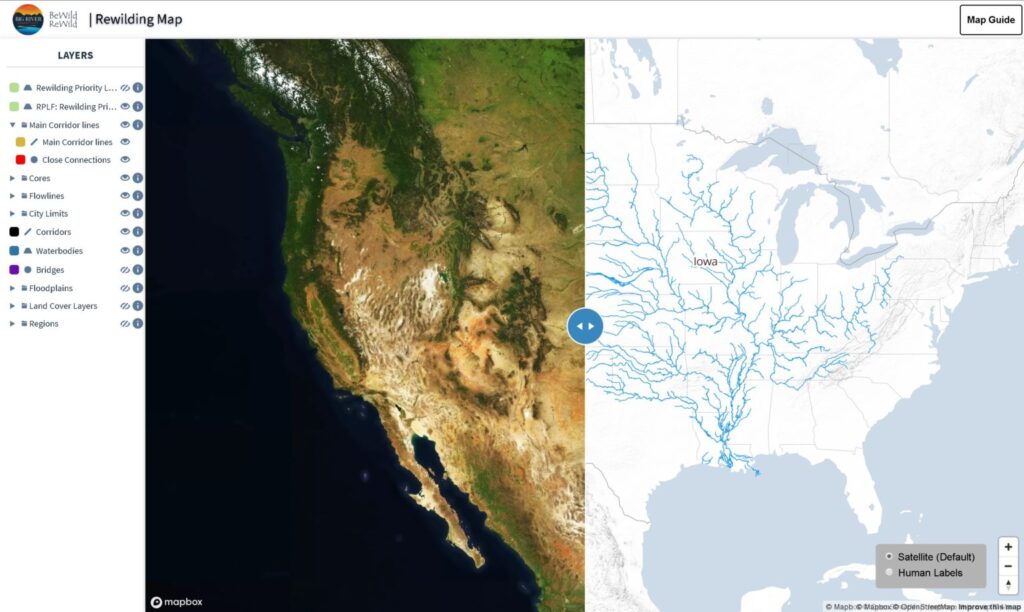
For effective conservation, maps are absolutely essential. This map is for BewildRewild, an organization devoted to rewilding Iowa and further into the Mississippi River Watershed. Explore the map – click on the guide in the upper-right and watch the overview videos.
Reuters did an article (Feb 17, 2017) about this map, and data was used by The New York Times (Mar 20, 2017). It was the only map available of the controversial Dakota Access Pipeline (DAPL), and used by people everywhere to understand and navigate the pipeline.
The animated map below was featured on the front page of the Huffington Post, in an article written by Nitin Gadia, Dec 16, 2016.
Genealogy
> The largest family tree
Using a dataset of the largest family tree at the time, with over a hundred million people, revealing maps were generated. One series of maps showed generational migration – Here, if a woman was born in London, and her child was born in New York, a dot would move from her birthdate in London to her child’s birthdate in New York. This is a map of randomly selected ancestors, from 1600-2010. See more videos and learn more in a blog post written about it.
Covid-19
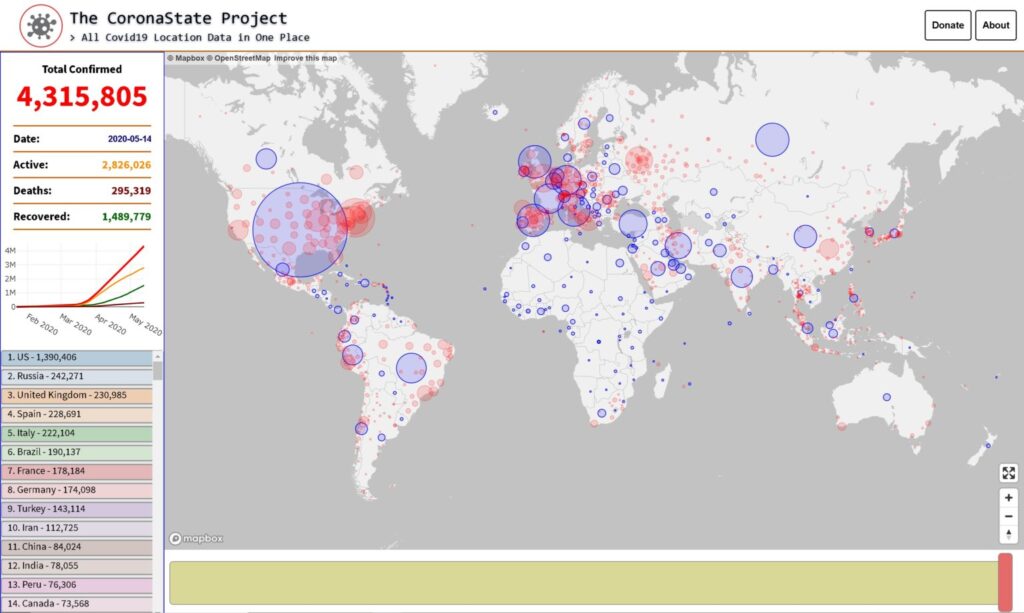
The CoronaState Project was an attempt to centralize and map the global Covid-19 pandemic that we all experienced. Our goal was to combine all the datasets we could find, and map as precisely as possible. As far as we know, no map had as effective and insightful visualizations as ours did, and at the time, no map covered the breadth and depth of data as we had. Slide the time on the bottom to see the data change from the time the pandemic started, and how it spread.
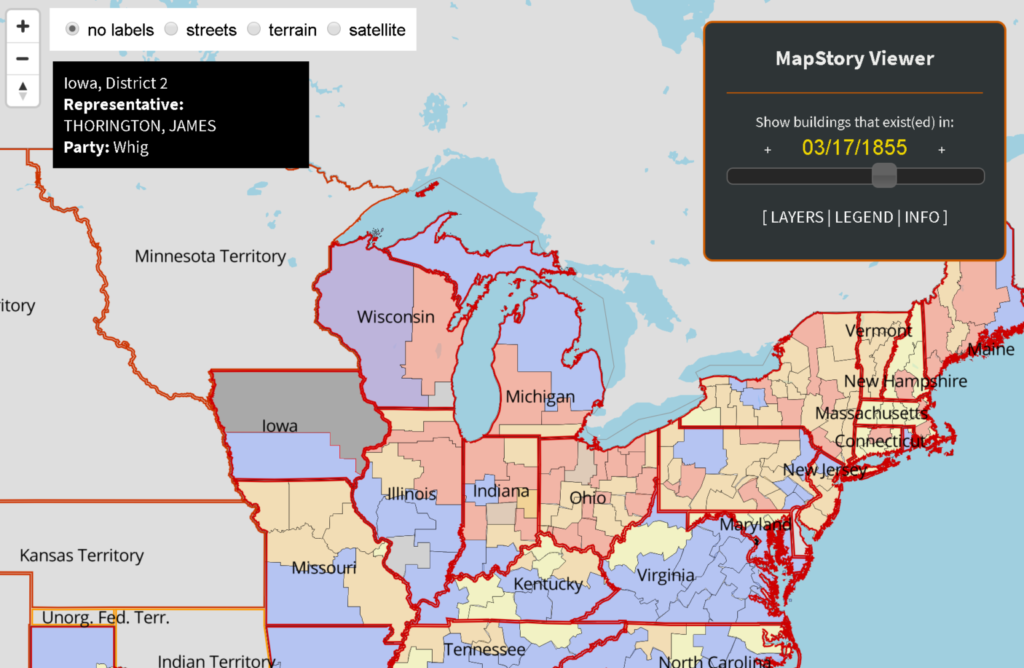
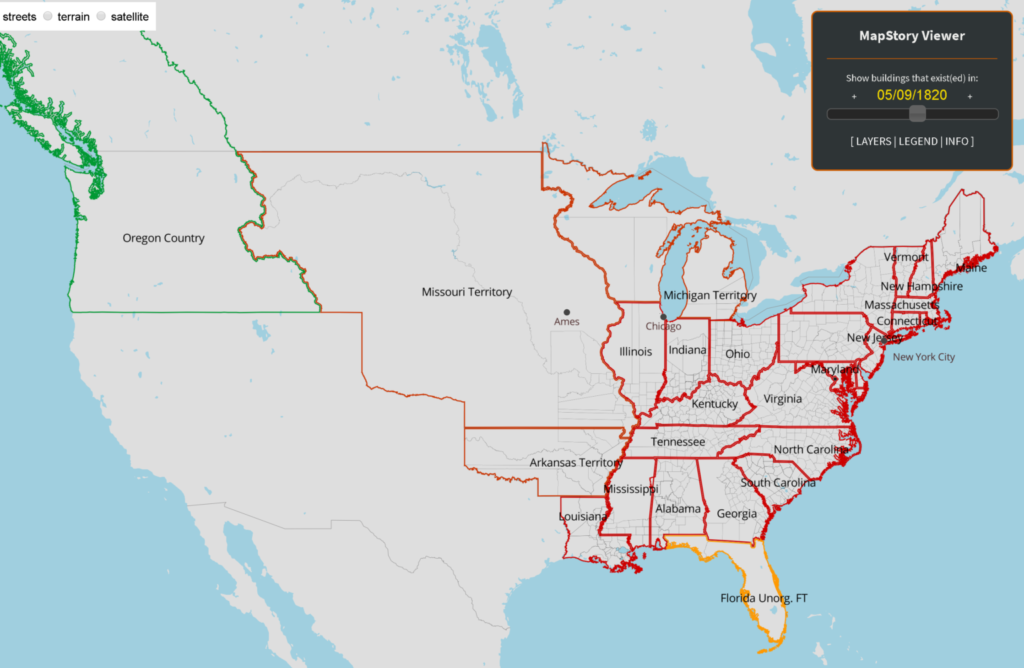
An effort to map US electorates over time. Users can see all congressional boundaries and how they changed. Districts are colored by party, and users can hover over a districts and see the representative at the time. This shows political geography deeply, and when combined with census data, this can be a great tool to study gerrymandering over time, among many other things. Start by moving the time slider in the upper right.
A dream is to create a crowdsourced historical map of the world – Like a google maps of the past, where you can go to a time, and see the way a place was then. Our MapStructor application will allow mass collaboration, and the project will be launched. In our desktop demo, we have a few places mapped – the US, India, and some cities. Move the time slider in the upper right.
Wildlife
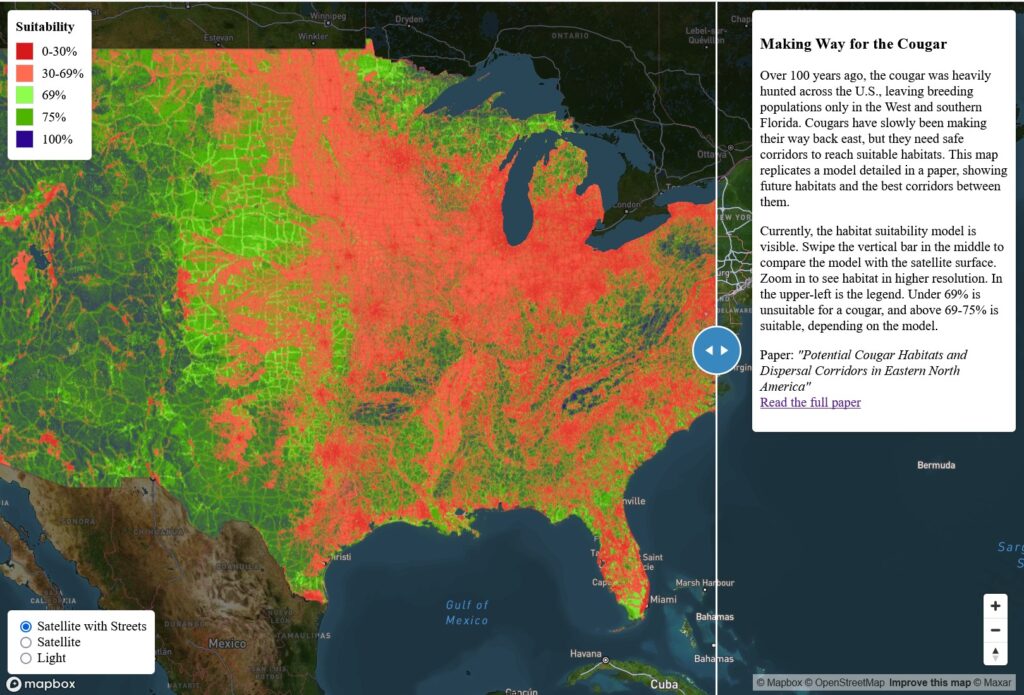
> Global Conservation Map
Conservation maps are absolutely essential for the most effective wildlife conservation. Today, tools can be used to find and prioritize the best habitats and paths between them. Here, a high resolution nationwide web map of cougar habitat cores has been generated, and the best corridors will be generated soon. This will be a part of a larger effort to map global wildlife.
Few web map applications, if any, have been as aesthetic, innovative and advanced as ours, with Mapping Early New York. We are currently make a front end application for anyone to build a map like ours. It will include the ability to create data as well.
Web maps are powerful tools, but they are difficult to make for people at all skill levels. People have to build data, upload it, generate tilesets, and do coding for wide functionality. MapStructor will solve those problems with a single online application anyone can use and collaborate with.
About Nitty Gritty Mapping
Nitty Gritty Mapping is run by Nitin Gadia, who comes up with ideas, solutions and tools for maps he envisions and designs. He finds the data needed, and hires and manages programmers and GIS specialists. He has hired over 100 people in over 50 countries to help with his projects.
In addition to being a digital cartographer, he produces multimedia of all kinds, including videos, graphics and writing. You can find that and more of his work on his personal website.